




Key Takeaways
- Resource utilization measures productive time, billable and non-billable alike, not just hours invoiced to clients.
- Most firms target 70-75% billable utilization; sustained utilization above 80% is a burnout warning sign, not a win.
- Utilization, realization, and profitability must be tracked together. Strong utilization with weak realization can still produce a loss.
- Connected ERP and reporting tools turn utilization from a monthly report into a real-time planning input.
- Boyer helps professional services firms connect project time, resource planning, and financials in Microsoft Dynamics 365 Project Operations integrated with Microsoft Dynamics 365 Finance & Supply Chain Management (F&SCM) or Microsoft Dynamics 365 Business Central.
For decades, professional services firms have treated billable hours as the ultimate measure of productivity: track the hours, bill the client, and profitability follows. But firms that manage by billable hours alone tend to hit the same wall. Utilization looks healthy on a report while margins shrink, good people burn out, and the work that protects long-term growth (training, business development, process improvement) never happens because it doesn’t show up on a timesheet.
Resource utilization is a real and important metric. Used on its own, though, it’s an incomplete picture of how a firm’s people, time, and capacity actually create value. Here’s what resource utilization means beyond the billable hour, the metrics that give it context, and how the right ERP and reporting tools turn utilization from a report you look at after the fact into something you can actually plan around.
What Is Resource Utilization in Professional Services?
Resource utilization measures the percentage of an employee’s available working hours spent on productive work. In its most common form, billable utilization, the formula is straightforward:
Utilization Rate = (Billable Hours ÷ Total Available Hours) × 100
A consultant who logs 30 billable hours in a 40-hour week is running at 75% utilization. “Billable utilization” and “resource utilization” are often used interchangeably when they shouldn’t be. Billable utilization only counts hours invoiced to clients. Resource utilization is broader: it includes all productive time, billable and non-billable alike, that keeps the firm running and growing.
Why Billable Hours Alone Don’t Tell the Whole Story
A meaningful share of the work that keeps a professional services firm healthy never touches a client invoice: proposal writing and business development, mentoring and training junior staff, internal process and IP development, quality review, and knowledge sharing. None of it is billable, and all of it is what wins the next client and keeps the current team intact. When a firm measures and rewards billable time only, it quietly discourages exactly that work.
Most experienced resource managers target roughly 70-75% billable utilization, intentionally reserving the remaining 25-30% of available hours for that non-billable, strategic work. According to SPI Research’s 2025 Professional Services Maturity Benchmark, which surveyed 403 firms, average billable utilization fell to 68.9% in 2024, with EBITDA margins dropping to 9.8%, the lowest in five years, closely tied to that decline. Sustained utilization above roughly 80% is widely linked to rising burnout and attrition: turnover that costs far more in recruiting, onboarding, and lost institutional knowledge than the “extra” billable hours ever generated. Utilization sustained well above 80% shouldn’t be read as a badge of efficiency; it’s a leading indicator that burnout risk is climbing.
The Three Metrics That Actually Explain Profitability
Utilization tells you how busy people are. It doesn’t tell you whether the firm is making money. For that, three metrics have to be read together:
- Utilization — the share of available hours spent on billable work.
- Realization — the share of billed time that’s actually collected as revenue, after write-downs, discounts, and scope pushback. A healthy realization rate typically falls between 85% and 95%; anything below 80% signals a pricing, scoping, or client-management problem.
- Profitability — whether the delivered work created value once true cost-to-serve is factored in.

A team can post strong utilization and still lose money if realization is weak or a project was priced incorrectly. Separating these three metrics, tracking utilization in one report and profitability in another, is how firms end up surprised at quarter-end.
Beyond Billable Hours: Treating Utilization as a Planning Tool, not a Scorecard
The more useful shift is treating utilization as a forward-looking planning input rather than a rearview-mirror scorecard. That means matching the right person, by skill, availability, and cost, to the right project before a bottleneck happens, managing bench time deliberately since some non-billable capacity is unavoidable and even healthy, and forecasting demand against supply by comparing the hours the pipeline will require against the hours the team actually has available, weeks or months out.
This is where most firms hit a wall with spreadsheets. Utilization data that’s a week or a month old isn’t useful for the staffing decision that needs to be made today.
How the Right Solutions Change the Utilization Conversation
This is exactly the gap that Microsoft Dynamics 365 Project Operations is built to close. Project Operations is Microsoft’s dedicated resourcing and project management application, and it comes with a purpose-built utilization view instead of a report that gets pieced together after the fact.
How Project Operations calculates and displays utilization
According to Microsoft’s Project Operations documentation, utilization is calculated automatically from approved time entries, and the system doesn’t lump every hour into a single number. It separates utilization into three categories:
- Billable utilization — chargeable actual hours divided by resource capacity.
- Non-billable utilization — actual time coded as non-chargeable, complementary, or not available, divided by resource capacity.
- Internal utilization — actual time logged with no sales contract, divided by resource capacity.
Resource capacity itself is calculated too: total work hours, minus out-of-office time and non-working days. That distinction matters. It’s the difference between measuring how full someone’s calendar looks and measuring how much of their paid time actually went to billable, business-building, or internal work.
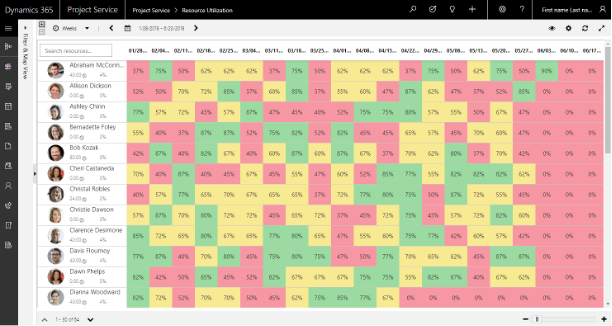
Each bookable resource, or their default resource role, gets a target utilization. Project Operations then displays a grid, in its Resource Utilization view, where each cell shows a resource’s billable utilization for a day, week, or month, and color-codes it against that target: green when utilization meets or exceeds the target, yellow when it’s within 20 points of target, and red when it falls more than 20 points below. Because that view is built on the Schedule Board, resource managers can filter it by role, practice area, or project, the same way they’d filter any staffing decision.
A utilization view alone is only half the equation. When Project Operations is integrated with Microsoft Dynamics 365 Finance & Supply Chain Management (F&SCM) or Microsoft Dynamics 365 Business Central (BC), timesheets, project budgets, and financial data all live in the same connected system. Instead of utilization sitting in one spreadsheet, realization in another, and profitability in a third, resource managers and finance leaders are working from the same numbers.
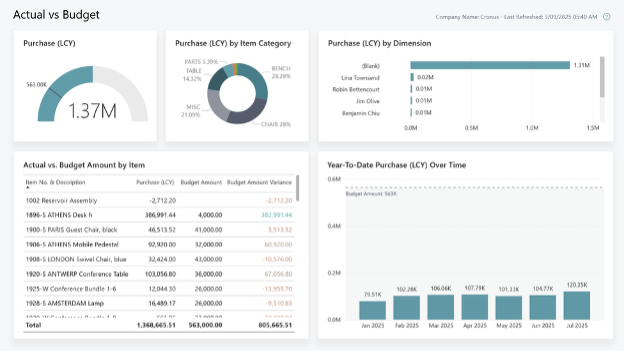
Layer in Power BI, and leadership gets real-time, drillable dashboards: utilization by person, team, practice area, or project, next to realization and margin. When Project Operations runs on F&SCM, for example, the Practice manager Power BI content, available right in the Project management workspace, tracks actual billable utilized hours against budgeted hours, budget gross margin by project, and earned value performance in a single view. The specific report varies depending on whether Project Operations is connected to F&SCM or Business Central, but the underlying discipline doesn’t: a staffing decision gets made before a project runs over budget, not explained after the fact.
Why Boyer
Boyer & Associates has more than 30 years of experience helping organizations get the most out of Microsoft Dynamics 365, and professional services firms are one of the industries we work with regularly. As a Microsoft Solutions Partner, we implement Microsoft Dynamics 365 Project Operations integrated with F&SCM or Microsoft Dynamics 365 Business Central to connect the project, resource, and financial data that utilization reporting depends on, so firms aren’t stitching timesheets, spreadsheets, and finance systems together by hand.
Practical Steps to Improve Resource Utilization This Quarter
- Track utilization, realization, and profitability together, never in isolation.
- Set an intentional non-billable allocation (commonly 20-25%) for business development, training, and internal projects, and protect it.
- Give resource managers real-time capacity dashboards instead of month-end spreadsheets.
- Review realization rates monthly to catch scoping or pricing problems while they’re still small.
- Treat sustained utilization above 80% as a staffing or hiring signal, not a win to celebrate.
Frequently Asked Questions
What is a good utilization rate for a professional services firm?
Most firms target 70-75% billable utilization, leaving the remaining 25-30% of available hours for non-billable but essential work like business development, training, and internal projects. Rates sustained above 80% are more often a warning sign of burnout risk than a mark of efficiency.
What’s the difference between utilization and realization?
Utilization measures how much of an employee’s available time is spent on billable work. Realization measures how much of that billed time is actually collected as revenue after write-downs, discounts, or scope adjustments. A firm can have high utilization and still lose money if realization is low.
Does higher utilization always mean higher profitability?
No. Utilization, realization, and profit margin have to be viewed together. High utilization paired with low realization or mispriced projects can still produce a loss.
How can firms get real-time visibility into resource utilization instead of relying on monthly reports?
Microsoft Dynamics 365 Project Operations, integrated with F&SCM or Business Central, connects timesheets, project budgets, and financials in one system. Tools like Power BI turn that data into live, drillable dashboards, giving resource managers and partners a current view of capacity instead of a lagging one.
The Bottom Line
Billable hours will always matter in professional services. But the firms protecting their margins, without burning out their best people, are the ones treating utilization as one input among several, alongside realization, profitability, and real-time capacity data.
Boyer helps professional services firms connect project time, resource planning, and financials in Microsoft Dynamics 365 Project Operations integrated with F&SCM or Microsoft Dynamics 365 Business Central, so utilization becomes a planning tool, not just a report. Talk to Boyer about resource management for your firm.
Read next: Beyond Reports: 4 Key Analytics in D365 F&SCM
Boyer & Associates is a Microsoft Solutions Partner with more than 30 years of experience helping professional services, manufacturing, agribusiness, and nonprofit organizations get the most out of Microsoft Dynamics 365. For project-based businesses, Boyer implements Microsoft Dynamics 365 Project Operations integrated with F&SCM or Business Central, along with Power BI, to connect project time, resource planning, and financials in one system.